At re:Invent 2025, Matt Garman announced AWS DevOps Agent, a frontier agent that resolves and proactively prevents incidents, continuously improving reliability and performance. As a member of the DevOps Agent team, we’ve focused heavily on making sure that the “incident response” capability of the DevOps Agent generates useful findings and observations. In particular, we’ve been working on making root cause analysis for native AWS applications accurate and performant. Under the hood, DevOps Agent has a multi-agent architecture where a lead agent acts as an incident commander: it understands the symptom, creates an investigation plan, and delegates individual tasks to specialized sub-agents when those tasks benefit from context compression. A sub-agent executes its task with a pristine context window and reports compressed results back to the lead agent. For example, when examining high-volume log records, a sub-agent filters through the noise to surface only relevant messages to the lead agent.
In this blog post, we want to focus on the mechanisms one needs to develop to build an agentic product that works. Building a prototype with large language models (LLMs) has a low barrier to entry – you can showcase something that works fairly quickly. However, graduating that prototype into a product that performs reliably across diverse customer environments is a different challenge entirely, and one that is frequently underestimated. This post shares what we learned building AWS DevOps Agent so you can apply these lessons to your own agent development.
In our experience, there are five mechanisms necessary to continuously improve agent quality and bridge the gap from prototype to production. First, you need evaluations (evals) to identify where your agent fails and where it can improve, while establishing a quality baseline for the types of scenarios your agent handles well. Second, you need a visualization tool to debug agent trajectories and understand where exactly the agent went wrong. Third, you need a fast feedback loop with the ability to rerun those failing scenarios locally to iterate. Fourth, you need to make intentional changes: establishing success criteria before modifying your system to avoid confirmation bias. Finally, you need to read production samples regularly to understand actual customer experience and discover new scenarios your evals don’t yet cover.
Evals are the machine learning equivalent of a test suite in traditional software engineering. Just like building any other software product, a collection of good test cases builds confidence in quality. Iterating on agent quality is similar to test-driven development (TDD): you have an eval scenario that the agent fails (the test is red), you make changes until the agent passes (the test is green). A passing eval means the agent arrived at an accurate, useful output through correct reasoning.
For AWS DevOps Agent, the size of an individual eval scenario is similar to an end-to-end test in the traditional software engineering testing pyramid. Looking through the lens of “Given-When-Then” style tests:
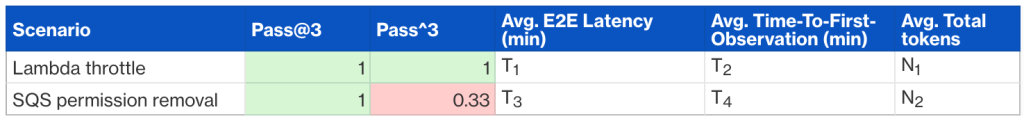
The evaluation report is structured with scenarios as rows and metrics as columns. Key metrics that we keep track of are capability (pass@k – whether the agent passed at least once in k attempts), reliability (pass^k – how many times the agent passed across k attempts, e.g., 0.33 means passed 1 out of 3 times for k=3), latency, and token usage.
There are several benefits to having evals:
Fast feedback loops help developers know whether code works (is it correct, performant, secure) and whether ideas are good (do they improve key business metrics). This may seem obvious, but far too often, teams and organizations tolerate slow feedback loops […] — Nicole Forsgren and Abi Noda, Frictionless: 7 Steps to Remove Barriers, Unlock Value, and Outpace Your Competition in the AI Era
There are several challenges with evals. In decreasing order of difficulty:
When an agent fails an eval or a production run, where do you start investigating? The most productive method is error analysis. Visualize the agent’s complete trajectory, every user-assistant message exchange including sub-agent trajectories, and annotate each step as “PASS” or “FAIL” with notes on what went wrong. This process is tedious but effective.
For AWS DevOps Agent, agent trajectories map to OpenTelemetry traces and you can use tools like Jaeger to visualize them. Software development kits like Strands provide tracing integration with minimal setup.
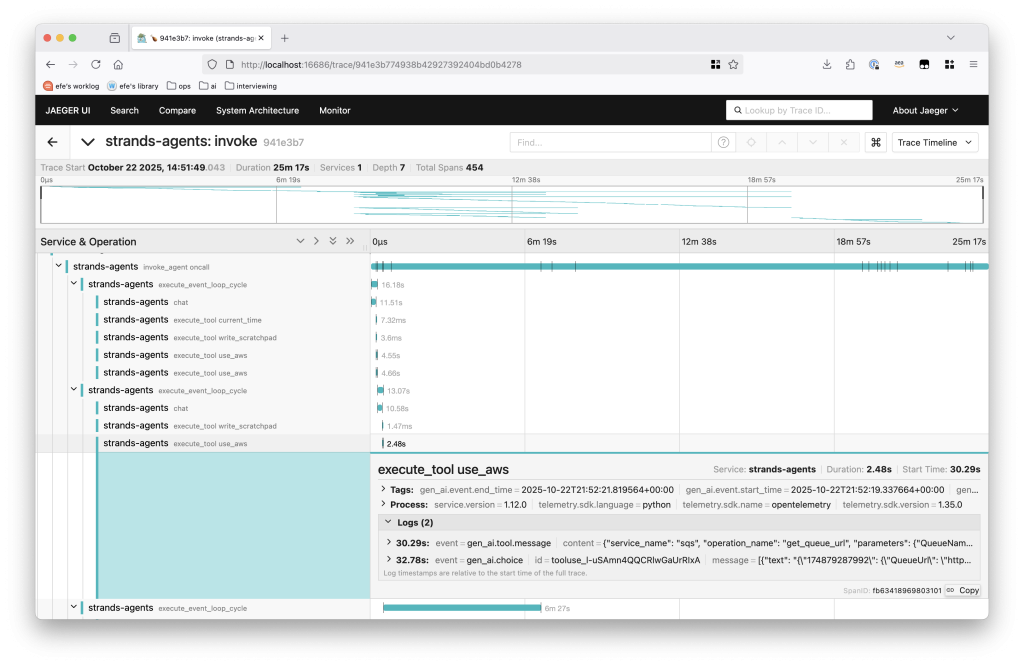
Figure 1 – A sample trace from AWS DevOps Agent.
Each span contains user-assistant message pairs. We annotate each span’s quality in a table such as the following:
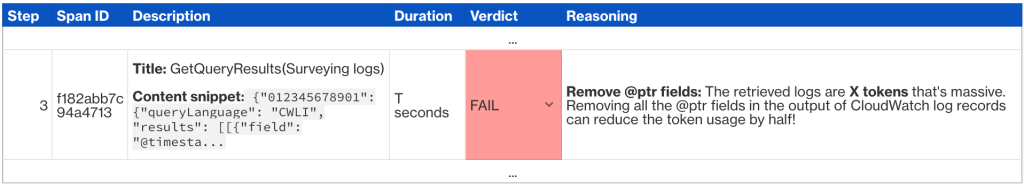
This low-level analysis consistently surfaces multiple improvements, not just one. For a single failing eval, one will typically identify many concrete changes spanning accuracy, performance, and cost.
I had learned from my dad the importance of intentionality — knowing what it is you’re trying to do, and making sure everything you do is in service of that goal. — Will Guidara, Unreasonable Hospitality: The Remarkable Power of Giving People More Than They Expect
You’ve identified failing scenarios and diagnosed the issues through trajectory analysis. Now it’s time to modify the system.
The biggest fallacy we’ve observed at this stage: confirmation bias leading to overfitting. Given the eval challenges mentioned earlier (slow feedback loops and the impracticality of comprehensive test suites) developers typically test only the few specific failing scenarios locally until they pass. One modifies the context (system prompt, tool specifications, tool implementations, etc.) until one or two scenarios pass, without considering broader impact. When changes don’t follow context engineering best practices, they likely have negative effects that we can’t capture through limited evals.
You need both diligence and judgment: establish success criteria through available evals and reusable past production scenarios, but also educate yourself on context engineering best practices to guide your changes. We’ve found Anthropic’s prompting best practices and engineering blog, Drew Breunig’s how long contexts fail, and lessons from building Manus particularly helpful resources.
Before making any change, define what success looks like:
This intentional framing protects against confirmation bias (interpreting results favorably) and sunk cost fallacy (accepting changes simply because you invested time). If your modifications don’t move the metrics as expected, reject them.
For example, when optimizing a sub-agent within AWS DevOps Agent, we establish a baseline by fixing git commit IDs and running the same scenario seven times. This reveals both typical performance and variance.
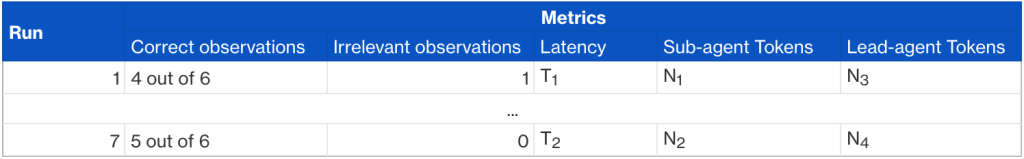
Each metric measures a different dimension:
After establishing the baseline, we compare these metrics against the same measurements with our proposed changes. This makes it clear whether the change is an actual improvement.
We’ve been fortunate to have several Amazon teams adopt AWS DevOps Agent early. A DevOps agent team member on rotation regularly samples real production runs using our trajectory visualization tool (similar to the OpenTelemetry-based visualization discussed earlier, but customized to render DevOps Agent-specific artifacts like root cause analysis reports and observations), marking whether the agent’s output was accurate and identifying failure points. Production samples are irreplaceable; they reveal the actual customer experience. Additionally, reviewing samples continuously refines your intuition of what the agent is good and bad at. When production runs aren’t satisfactory, you have real-world scenarios to iterate against: modify your agent locally, then rerun it against the same production environment until the desired outcome is reached. Establishing rapport with a few critical early adopter teams willing to partner in this way is invaluable. They provide ground truth for rapid iteration and create opportunities to identify new eval scenarios. This tight feedback loop with production data works in conjunction with eval-driven development to form a comprehensive test suite.
Building an agent prototype that demonstrates the feasibility of solving a real business problem is an exciting first step. The harder work is graduating that prototype into a product that performs reliably across diverse customer environments and tasks. In this post, we’ve shared five mechanisms that form the foundation for systematically improving agent quality: evals with realistic and diverse scenarios, fast feedback loops, trajectory visualization, intentional changes, and production sampling.
If you’re building an agentic application, start building your eval suite today. Even starting with a handful critical scenarios will establish the quality baseline needed to measure and improve systematically. To see how AWS DevOps Agent applies these principles to incident response, check out our getting started guide.
Efe Karakus is a Sr. Software Engineer on the AWS DevOps Agent team, primarily focusing on agent development.